Monitoring Spring applications with Micrometer, Telegraf and Splunk
Writing a Spring app is one thing, but monitoring a fleet of them in production is often a challenge. I’m going to show you how to setup basic metrics for any Spring web app locally and then describe how you can scale it.
Before we move into the “how to” part, let me describe a few tools we’re going to use:
- Micrometer - it’s a vendor-neutral application metrics facade. There are a lot of different monitoring systems, so a facade tries to introduce a universal interface. It’s like SLF4J but for metrics.
- Spring Actuator - it’s the Spring module that provides us with tools to monitor our application - including full support for Micrometer
- Statsd - as mentioned, Micrometer is a facade, and Statsd is the implementation we’re going to use. It deals with collecting and sending measurements to a dedicated backend service
- Telegraf - this is our “dedicated backend”. It’s responsible for receiving raw measurement data, aggregate it and send it to the dashboard
- Splunk - Splunk is the final destination for our metrics data, it’s the engine we’re going to use to turn those magical numbers into pretty visuals
All the code and configuration files for this example can be found on github
How to do it
As usual with Spring Boot, the first thing we need to do is add dependencies. In this case, we want to specify that we want to use Spring Actuator and then that we want Statsd to be the implementation used for our Micrometer facade:
implementation 'org.springframework.boot:spring-boot-starter-actuator'
implementation 'io.micrometer:micrometer-registry-statsd:1.6.4'
At this point, our application should start collecting metrics already. We can take a peek locally by telling Actuator to expose the metrics:
management.endpoints.web.exposure.include: metrics
If we now start the app and go to localhost:8080/actuator/metrics, we’ll see a bunch of metric labels, such as jvm.memory.max or process.cpu.usage. You can expose more endpoints (like health, for example) and by default they will be under /actuator/<endpoint> path, but you can change that with the base-path property.
Cool, let’s now configure our app to send those metrics to our dedicated backend, which in this case is Telegraf. Simply add this to application.yml:
management.metrics.export.statsd:
  enabled: true
  flavor: telegraf
  port: 8125
This will make our app attempt to send metrics to localhost:8125 in telegraf format.
There’s nothing listening locally on port 8125 though, so let’s bring something up using docker-compose - let’s create this docker-compose.yml file:
version: '3'

services:
  telegraf:
    image: telegraf:1.5.3
    volumes:
      - ./telegraf.conf:/etc/telegraf/telegraf.conf:ro
    ports:
      - "8125:8125/udp"
Before we can start our Telegraf service though, we need to include a configuration file for it, so let’s create telegraf.conf in the root directory of our app:
# Telegraf Configuration
# Global tags can be specified here in key="value" format.
[global_tags]
    app = "demo-app"

# Configuration for telegraf agent
[agent]
    ## Default data collection interval for all inputs
    interval = "10s"
    ## Rounds collection interval to 'interval'
    round_interval = true
    ## This controls the size of writes that Telegraf sends to output plugins.
    metric_batch_size = 1000
    ## This buffer only fills when writes fail to output plugin(s).
    metric_buffer_limit = 10000
    ## Collection jitter is used to jitter the collection by a random amount.
    collection_jitter = "0s"
    flush_interval = "10s"
    flush_jitter = "0s"
    precision = ""

    ## Logging configuration:
    debug = true
    ## Run telegraf in quiet mode (error log messages only).
    quiet = false
    ## Specify the log file name. The empty string means to log to stderr.
    logfile = "/var/log/telegraf.log"
    ## Override default hostname, if empty use os.Hostname()
    hostname = ""
    ## If set to true, do no set the "host" tag in the telegraf agent.
    omit_hostname = false


###############################################################################
#                            OUTPUT PLUGINS                                   #
###############################################################################

[[outputs.http]]
    ## URL is the address to send metrics to
    url = "http://splunk:8088/services/collector"
    ## Timeout for HTTP message
    # timeout = "5s"
    ## Optional TLS Config
    # tls_ca = "/etc/telegraf/ca.pem"
    # tls_cert = "/etc/telegraf/cert.pem"
    # tls_key = "/etc/telegraf/key.pem"
    ## Use TLS but skip chain & host verification
    #insecure_skip_verify = true
    ## Data format to output.
    ## Each data format has it's own unique set of configuration options, read
    ## more about them here:
    ## https://github.com/influxdata/telegraf/blob/master/docs/DATA_FORMATS_OUTPUT.md
    data_format = "splunkmetric"
    ## Provides time, index, source overrides for the HEC
    splunkmetric_hec_routing = true
    ## Additional HTTP headers
    [outputs.http.headers]
        # Should be set manually to "application/json" for json data_format
        Content-Type = "application/json"
        Authorization = "Splunk 6ce8ed80-682c-4bc1-80bb-30b60e1807ec"
        X-Splunk-Request-Channel = "6ce8ed80-682c-4bc1-80bb-30b60e1807ec"

###############################################################################
#                            INPUT PLUGINS                                    #
###############################################################################

# Statsd UDP/TCP Server
[[inputs.statsd]]
    ## Protocol, must be "tcp", "udp", "udp4" or "udp6" (default=udp)
    protocol = "udp"

    ## MaxTCPConnection - applicable when protocol is set to tcp (default=250)
    max_tcp_connections = 250

    ## Address and port to host UDP listener on
    service_address = ":8125"

    ## The following configuration options control when telegraf clears it's cache
    ## of previous values. If set to false, then telegraf will only clear it's
    ## cache when the daemon is restarted.
    ## Reset gauges every interval (default=true)
    delete_gauges = true
    ## Reset counters every interval (default=true)
    delete_counters = true
    ## Reset sets every interval (default=true)
    delete_sets = true
    ## Reset timings & histograms every interval (default=true)
    delete_timings = true

    ## Percentiles to calculate for timing & histogram stats
    percentiles = [90]

    ## separator to use between elements of a statsd metric
    metric_separator = "_"

    ## Parses tags in the datadog statsd format
    ## http://docs.datadoghq.com/guides/dogstatsd/
    parse_data_dog_tags = false
    ## Number of UDP messages allowed to queue up, once filled,
    ## the statsd server will start dropping packets
    allowed_pending_messages = 10000

    ## Number of timing/histogram values to track per-measurement in the
    ## calculation of percentiles. Raising this limit increases the accuracy
    ## of percentiles but also increases the memory usage and cpu time.
    percentile_limit = 1000
This is a mostly default config file for Telegraf. The first section configures the agent itself, the second section configures the output (which is Splunk in our case) and the last one configures an input (statsd in this case).
You might have noticed there is an Authorization header included in the output config - that is something that we will have to fill in once we auto-generate a splunk config as a next step.
Setting up Splunk
The first thing we need to do is prepare a config file. Luckily, Splunk’s docker image contains a tool to generate one for us:
docker run --rm -it -e SPLUNK_PASSWORD=<password> splunk/splunk:latest create-defaults > spring-config.yml
Once it’s created, find a hec section inside and make sure it’s enabled and the proper password is specified. Then copy the token and put it in the telegraf.conf under Authorization and X-Splunk-Request-Channel.
Finally, let’s add Splunk to our docker-compose.yaml file:
version: '3'

services:

  telegraf:
    image: telegraf:1.17.2
    volumes:
      - ./telegraf.conf:/etc/telegraf/telegraf.conf:ro
    ports:
      - "8125:8125/udp"

  splunk:
    image: splunk/splunk:8.1.2
    volumes:
      - ./splunk-config.yml:/tmp/defaults/default.yml
      - ./indexes.conf:/opt/splunk/etc/system/local/indexes.conf
    environment:
      - SPLUNK_START_ARGS=--accept-license
      - SPLUNK_PASSWORD=<password>
    ports:
      - 8000:8000
      - 8088:8088
You might notice there’s an indexes.conf file we still need to create. We’ll use that file to create a spring_metrics index:
[default]
[spring_metrics]
homePath = $SPLUNK_DB/spring_metrics/db
coldPath = $SPLUNK_DB/spring_metrics/cold
thawedPath = $SPLUNK_DB/spring_metrics/thawed
datatype = metric
metric.timestampResolution = ms
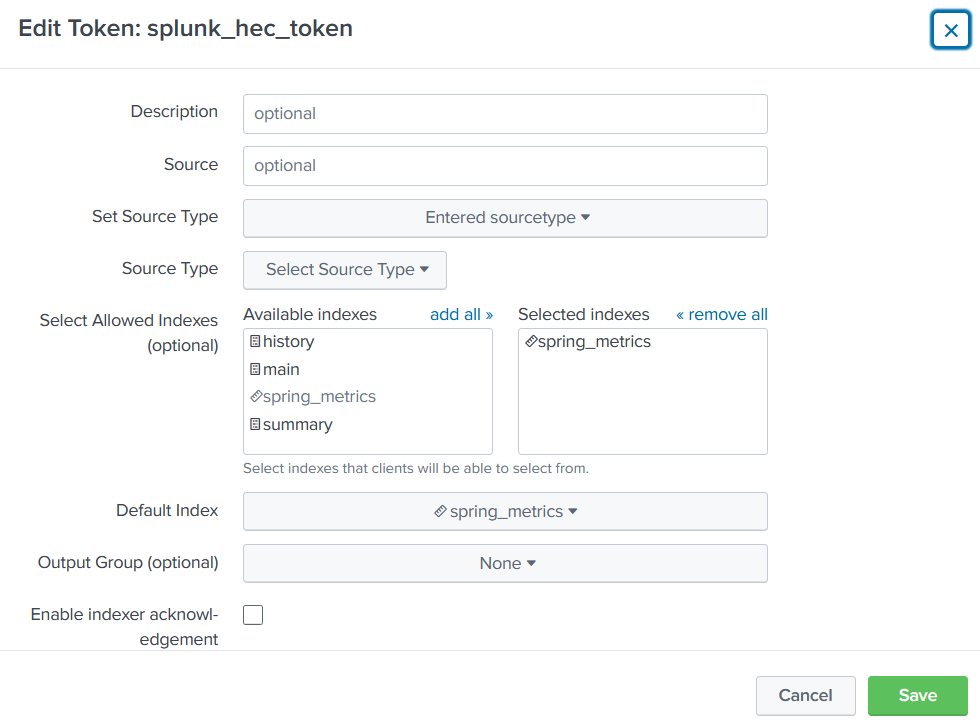
That’s all we need. We can now run docker-compose up and wait a few minutes for Splunk to come up. After that we can login at localhost:8000 with admin and the password you’ve set. After logging in, we need to go to Settings -> Data inputs and edit the splunk_hec_token- select “spring_metrics” under “Selected Indexes” and save.
If you now launch the application itself, give it a minute or two and go to “Search” in Splunk you can see available metrics after running
| mcatalog values(metric_name) where index=spring_metrics
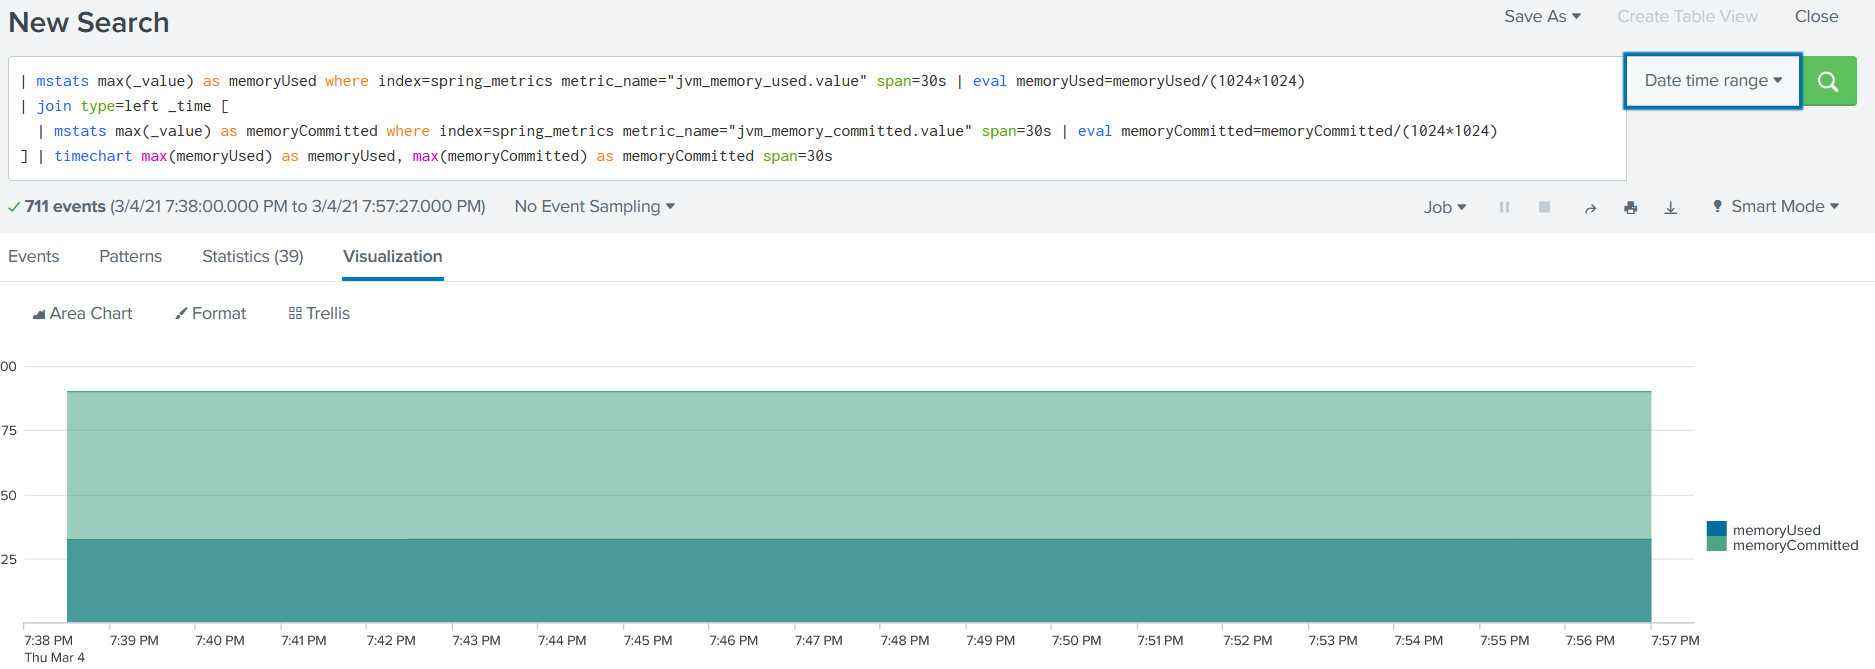
You can now use these metrics to create dashboards. Here’s an example of a search query to view a single chart with JVM memory used and committed:
| mstats max(_value) as memoryUsed where index=spring_metrics metric_name="jvm_memory_used.value" span=30s | eval memoryUsed=memoryUsed/(1024*1024)
| join type=left _time [
  | mstats max(_value) as memoryCommitted where index=spring_metrics metric_name="jvm_memory_committed.value" span=30s | eval memoryCommitted=memoryCommitted/(1024*1024)
] | timechart max(memoryUsed) as memoryUsed, max(memoryCommitted) as memoryCommitted span=30s
You should get something like this:
A few words on scale
Splunk is designed to handle large amounts of data, so all you need to do is take the “local Splunk” part of this guide and set it up as a cluster. Then setup your Spring apps on Kubernetes with a sidecar container running Telegraf and re-use the first parts of this guide to direct the metric traffic from app to Telegraf and from Telegraf sidecar container to Splunk cluster.